Analyzing Facebook Ad AB-Test Performance with R
I’m experimenting with Facebook Advertising to help increase awareness for my micro-startup Rowing in Motion. As I’m trying various content and target combinations analyzing the campaign statistics for significant differences in ad-performance is important to find the best way to reach your target audience.
This is just a quick post to outline the steps necessary to do an ANOVA analysis with R on Facebook Ad Campaign Reports. I won’t go into the details of ANOVA here, but in short it let’s you analyse whether the means for any number of groups are equal or not and to what level of significance.
For a proper ANOVA, your data must have three important properties:
- Normal Distribution
- Homogenous Variance
- Indepedence
Independence is easily statisfied because your ads are never shown together (each impression is independent from a previous one). There are various ways to check these, but the easiest is to plot the variance and if it looks homogenous enough use that (you can also use a Levene test). Normal distribution can be assumed.
To get the data from Facebook, generate a report with all the campaigns you want to compare and select daily summary and download it as CSV.
Next, fire up R and load the data
> fb.data  names(fb.data)

 [1] "Date"               "Campaign"           "Campaign.ID"        "Impressions"        "Social.Impressions" "Social.."

 [7] "Clicks"             "Social.Clicks"      "CTR"                "Social.CTR"         "CPC"                "CPM"

[13] "Spent"              "Reach"              "Frequency"          "Social.Reach"       "Actions"            "Page.Likes"

[19] "App.Installs"       "Event.Responses"    "Unique.Clicks"      "Unique.CTR"
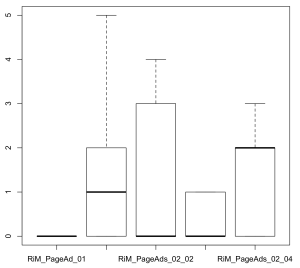
Next up, we want to attach the data to spare us some typing down the road and then create a simple Whisker plot (I’m plotting Campaign vs. Likes but you can substitute that with Clicks etc.):
> attach(fb.data)

> plot(Campaign, Page.Likes)

Now we’re going to create the ANOVA:
fb.aov summary.lm(fb.aov)
Call:
aov(formula = Page.Likes ~ Campaign, data = fb.data)
Residuals:
Min 1Q Median 3Q Max
-1.6667 -1.2222 0.0000 0.6667 3.3333
Coefficients:
Estimate Std. Error t value Pr(>|t|)
(Intercept) -1.986e-16 4.120e-01 0.000 1.00000
CampaignRiM_PageAds_02_01 1.667e+00 5.827e-01 2.860 0.00669 **
CampaignRiM_PageAds_02_02 1.222e+00 5.827e-01 2.098 0.04230 *
CampaignRiM_PageAds_02_03 3.333e-01 5.827e-01 0.572 0.57047
CampaignRiM_PageAds_02_04 1.222e+00 5.827e-01 2.098 0.04230 *
---
Signif. codes: 0 '***' 0.001 '**' 0.01 '*' 0.05 '.' 0.1 ' ' 1
Residual standard error: 1.236 on 40 degrees of freedom
Multiple R-squared: 0.221, Adjusted R-squared: 0.1431
F-statistic: 2.836 on 4 and 40 DF, p-value: 0.03674
The Null-hypothesis of an ANOVA is that the expected value is equal among all groups. If the test shows a low p-value (<0.05) we call that a significant difference. The above lm.summary has chosen the first group as the intercept, which means the reference group. If we want to conclude that a certain type of ad has performed better than the reference ad, there better be a significant difference (indicated with confidence level by the ** characters). This ANOVA has shown that CampaignRiM_PageAds_02_01 has performed significantly different than the reference campaign, while we can’t draw that conclusion for Campaign RiM_PageAds_02_03 (no significant difference).
You can choose another reference group using relevel:
refCampaign  summary.lm(aov(Page.Likes ~ refCampaign))

>....
We can also do a pairwise t-test (we need to do a Bonferroni Adjustment though, Holms method is a safe choice) to see which groups have significantly different means. The p-value reflects the probability of achieving the measured or an even more extreme outcome if the Null-hypothesis holds (H0: all means are equal). In this case, only the difference between the reference campaign RiM_PageAd_01 and RiM_PageAds_02_01 is significant enough.
> pairwise.t.test(Page.Likes, Campaign, p.adj = "holm")
Pairwise comparisons using t tests with pooled SD
data: Page.Likes and Campaign
RiM_PageAd_01 RiM_PageAds_02_01 RiM_PageAds_02_02 RiM_PageAds_02_03
RiM_PageAds_02_01 0.067 - - -
RiM_PageAds_02_02 0.338 1.000 - -
RiM_PageAds_02_03 1.000 0.247 0.810 -
RiM_PageAds_02_04 0.338 1.000 1.000 0.810
P value adjustment method: holm
